Classify Wine Data with Libsvm in Matlab

This a simple example of the classification with Libsvm in Matlab.

You can download the wine data from here.

Data Preprocessing

Load the wine data , and save it to winedata

1
2
3
4
5
6
7
8
9
uiimport('wine.data');

wine_label = wine(:, 1);
wine_data = wine(:, 2:end);
categories = {'Alcohol'; 'Malic acid'; 'Ash'; 'Alcalinity of ash'; 'Magnesium'; 'Total phenols'; 'Flavanoids'; 'Nonflavanoid phenols'; 'Proanthocyanins'; 'Color intensitys'; 'Hue'; 'OD280/OD315 of diluted wines'; 'Proline'};
classnumber = 3;
save winedata.mat;

load winedata;

Show the box figure of test data

1
2
3
4
5
figure;
boxplot(wine_data, 'orientation', 'horizontal', 'labels', categories);
title('Wine Data Box Figure', 'FontSize',12);
xlabel('Attribute Value', 'FontSize', 12);
grid on;

Show the fractal dimension figure of test data

1
2
3
4
5
6
7
8
9
10
11
12
13
14
15
16
17
18
19
20
figure
subplot(3, 5, 1);
hold on
for run = 1:178
plot(run,wine_label(run), '*');
end
xlabel('Sample', 'FontSize', 10);
ylabel('Label', 'FontSize', 10);
title('class', 'FontSize', 10);
for run = 2:14
subplot(3, 5, run);
hold on;
str = ['attrib ', num2str(run-1)];
for i = 1:178
plot(i, wine(i, run-1), '*');
end
xlabel('Sample', 'FontSize', 10);
ylabel('Attribute Value', 'FontSize', 10);
title(str, 'FontSize', 10);
end

Choose train set and test set

1
2
3
4
5
6
7
8
9
10
11
12
13
14
15
% Select 1-30 of the first cultivar, 60-95 of the second cultivar, and 131-153 of the third cultivar as train set

train_wine_data = [wine_data(1:30, :); wine_data(60:95, :); wine_data(131:153, :)];

% And split the labels

train_wine_labels = [wine_label(1:30); wine_label(60:95); wine_label(131:153)];

% Select 31-59 of the first cultivar, 96-130 of the second cultivar, 154-178 of the thrid cultivar as test set

test_wine_data = [wine_data(31:59, :); wine_data(96:130, :); wine_data(154:178, :)];

% And split the labels

test_wine_labels = [wine_label(31:59); wine_label(96:130); wine_label(154:178)];

[0, 1] scaling

1
2
3
4
5
6
7
8
9
10
[mtrain,ntrain] = size(train_wine_data);
[mtest,ntest] = size(test_wine_data);

dataset = [train_wine_data; test_wine_data];

[dataset_scale, ps] = mapminmax(dataset', 0, 1);
dataset_scale = dataset_scale';

train_wine_data = dataset_scale(1:mtrain, :);
test_wine_data = dataset_scale((mtrain+1):(mtrain+mtest), :);

SVM Train and Predict

Training

1
model = svmtrain(train_wine_labels, train_wine_data, '-c 2 -g 1');

Result:

*
optimization finished, #iter = 47
nu = 0.178691
obj = -12.867480, rho = 0.692153
nSV = 21, nBSV = 7
*
optimization finished, #iter = 44
nu = 0.065614
obj = -3.476909, rho = 0.077960
nSV = 14, nBSV = 0
*
optimization finished, #iter = 46
nu = 0.209059
obj = -15.592942, rho = -0.187650
nSV = 20, nBSV = 7
Total nSV = 41

Predicting

1
[predict_label, accuracy, decision_values] = svmpredict(test_wine_labels, test_wine_data, model);

Result:

Accuracy = 98.8764% (88/89) (classification)

Analysis of Result

1
2
3
4
5
6
7
8
9
10
11
12
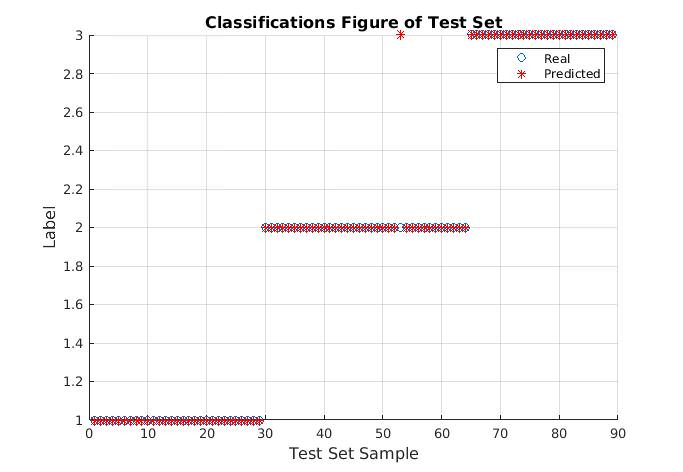
% Real and predicted classifications figure of test set
% The figure shows that only one sample was classified improperly

figure;
hold on;
plot(test_wine_labels,'o');
plot(predict_label,'r*');
xlabel('Test Set Sample','FontSize',12);
ylabel('Label','FontSize',12);
legend('Real','Predicted');
title('Classifications Figure of Test Set','FontSize',12);
grid on;

Classifier Parameters Optimization

1
2
3
4
5
6
7
% Roughly select: c & g range in 2^(-10),2^(-9),...,2^(10)
[bestacc,bestc,bestg] = SVMcgForClass(train_wine_labels,train_wine_data,-10,10,-10,10);

% Print the result of rough selection
disp('Printing the result of rough selection');
str = sprintf( 'Best Cross Validation Accuracy = %g%% Best c = %g Best g = %g',bestacc,bestc,bestg);
disp(str);

Result:

Printing the result of rough selection
Best Cross Validation Accuracy = 97.7528% Best c = 1.31951 Best g = 1.31951
1
2
3
4
5
6
% Precisely: c range in 2^(-2),2^(-1.5),...,2^(4), g range in 2^(-4),2^(-3.5),...,2^(4),
[bestacc,bestc,bestg] = SVMcgForClass(train_wine_labels,train_wine_data,-2,4,-4,4,3,0.5,0.5,0.9);
% Print the result of precise selection:
disp('Printing the result of precise selection');
str = sprintf( 'Best Cross Validation Accuracy = %g%% Best c = %g Best g = %g',bestacc,bestc,bestg);
disp(str);

Result:

Printing the result of precise selection
Best Cross Validation Accuracy = 97.7528% Best c = 0.353553 Best g = 1

Accuracy is lower than c = 2, g = 1’s, WHY?

P.S. SVMcgForClass is a function written by faruto.

Mastodon